


By Darren Fife, PHEc
Earlier this year, I was doing my usual weekly grocery run, stocking up for the days ahead. My meals during the week tend to follow a pretty predictable rhythm, so these trips rarely require much thought. I moved through the store on autopilot—fruit and vegetables, my ever-reliable omega-3 eggs—before heading to the yogurt section. Yogurt is a staple for me. I usually mix a plain Greek yogurt with a flavoured one to keep the sugar in check while still enjoying a bit of sweetness.

As I reached for my go-to brand, something caught my attention. The label looked identical—the same brand, the same flavour—but the protein content, boldly displayed on the front, had dropped from 14 grams to 9 grams per serving. That number is part of what draws me (and likely plenty of other shoppers) to that product in the first place, so the change stopped me in my tracks. I flipped the container over, scanning the nutrition facts panel, trying to make sense of it. Nothing obvious stood out. Was this a new product? A quiet reformulation? And where had those five grams of protein gone? Still puzzled, I tossed it into my cart and carried on. But the question lingered.
When I got home and started putting my groceries away, I pulled out the nearly empty yogurt container from the week before and set it beside the new one for comparison. Truthfully, I don’t have nutrition numbers memorized—without that side-by-side, I’m not sure I would have noticed anything at all. If the protein claim hadn’t been prominently displayed on the front of both packages, this likely would have slipped right past me.
As I went back and forth between the two containers, the answer slowly revealed itself: the portion size had changed. The original product listed a serving size of ¾ cup (180 mL), while the newer version had been reduced to ½ cup (120 mL). Same brand. Same packaging. Same impression. It left me wondering: why the change?
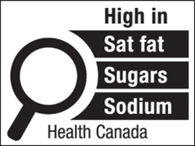
As I sat with this, I was reminded of the new front-of-package nutrition labelling required in Canada on packaged goods with high levels of sodium, sugar, and saturated fat. In theory, the goal is clear: give consumers clearer information and encourage companies to reformulate their products in the interest of public health. But standing in my kitchen, comparing those two yogurt containers, I found myself wondering whether reformulation is always the path companies take—or if there are other, less visible ways they respond. These are not arbitrary concerns either; they reflect well-established patterns in Canadian diets, where intake regularly exceeds recommended levels.
For sodium, the recommended intake for the average Canadian is 1500 mg per day, with an upper limit of 2300 mg—roughly one teaspoon (5 mL) of table salt. More than 58% of Canadians exceed that upper limit, with males aged 19 to 30 consuming as much as 3420 mg daily (Government of Canada, 2018).
A similar pattern exists with sugar. The World Health Organization recommends limiting added sugars to no more than 10% of total daily calories—about 50 grams, or roughly 12 sugar cubes (World Health Organization, 2015). And still, according to the 2015 Canadian Community Health Survey, about two-thirds of Canadians exceed that amount (Statistics Canada, 2017).
Saturated fat follows the same story. High intake remains strongly linked to increased LDL cholesterol and elevated risk of cardiovascular disease, which is still one of the leading causes of death in Canada (Public Health Agency of Canada, 2022).
According to Health Canada (2026), diets high in sodium, sugar, and saturated fat are associated with increased risk of stroke, obesity, heart disease, type 2 diabetes, high blood pressure, and certain cancers. And there’s evidence that front-of-package nutrient warnings can change consumer behaviour. Countries like Chile have implemented similar labelling systems, with measurable shifts in consumer behaviour (Taillie et al., 2021).
But this raises an important question: what actually counts as “high”?
The answer lies in the % Daily Value column on the nutrition facts table. Based on a 2000-calorie diet, this column shows how much one serving of a food contributes to your daily intake of a given nutrient. As a general rule, 5% or less is considered low, while 15% or more is considered high. For nutrients like fibre, vitamin C, and iron, higher percentages are beneficial. For sodium, sugar, and saturated fat—lower is better.
And this is where my yogurt comes back into the picture.
If the serving size had remained at ¾ cup (180 mL), the sugar and saturated fat content would each have reached about 17% of the daily value. That would be high enough to trigger a front-of-package warning label. But by reducing the serving size to ½ cup (120 mL), those percentages drop just below the threshold. No reformulation. No meaningful change to the product itself. Just a smaller serving size. And with it, a smaller protein number on the front of the package—the answer to my missing five grams.
Darren is a professional home economist based in Winnipeg, Manitoba, where he teaches Foods and Nutrition to students in Grades 9–12 at Maples Collegiate. Fresh off completing his Master of Education (Home Economics) from the University of British Columbia this past May, he brings both passion and curiosity into his kitchen classroom. When he’s not teaching, you’ll likely find him tending to his tomato plants (and an ever-growing collection of flowers), out camping or fishing, or singing with a choir. He also enjoys the craft of stained glass art—and is happily kept company at home by his cat, Ollie.
References
Government of Canada, Health Canada. (2018). Sodium intake of Canadians in 2017. https://www.canada.ca/content/dam/hc-sc/documents/services/publications/food-nutrition/sodium-intake-canadians-2017/2017-sodium-intakes-report-eng.pdf
Health Canada. (2026). Front-of-package nutrition labelling. https://www.canada.ca/en/health-canada/services/food-nutrition/nutrition-labelling/front-package.html
Public Health Agency of Canada. (2022). Heart disease in Canada. https://www.canada.ca/en/public-health/services/publications/diseases-conditions/heart-disease-canada.html
Statistics Canada. (2017). Canadian Community Health Survey (CCHS) – Nutrition, 2015 https://www.canada.ca/en/health-canada/services/food-nutrition/food-nutrition-surveillance/health-nutrition-surveys/canadian-community-health-survey-cchs/reference-guide-understanding-using-data-2015.html
Taillie, L. S., Reyes, M., Colchero, M. A., Popkin, B., & Corvalán, C. (2021). Changes in food purchases after the Chilean policies on food labelling, marketing, and sales in schools: A before-and-after study. The Lancet Planetary Health, 5(8), e526–e533. https://www.sciencedirect.com/science/article/pii/S2542519621001728
World Health Organization. (2015). Guideline: Sugars intake for adults and children. https://iris.who.int/server/api/core/bitstreams/4be74f01-de93-4596-bbd1-02a97afb1221/content